


Guilty Gullspånger | Michaelangelo’s David
A Graphic Novel.

Welcome back, everyone. It’s been a long 2+ weeks, and CITY hasn’t given us much to talk about. Until now.
Adjö Olof. Good day to CITY’s fourth manager, David Critchley.
What could Olof have done to keep his job, and what can Critch do to maximize this opportunity?
Let’s dig in.
Olof. The Guilty Gullspånger
What went wrong? 11 straight winless in the league, and a cup exit, for starters. But the overarching theme of Olof’s tenure will be defined by one word. Injuries.
You’re likely well-versed in our Best XI theory, and the difference in results we’ve seen with +/- 75% (8/11) of the starting lineup being the best-case option (credit to the Discord, TT), but here are the final results of his regime.

And for those curious as to what the “Best XI” is:
Bürki - Totland, Kessler, Nilsson/Baumgartl, Horn, Wallem - Durkin, Löwen - Hartel - Teuchert, Klauss.
Yep, that’s 12, because CCB is such a question mark. So, Olof had 12 chances to get 8/11 on the pitch, and up until Memorial Day weekend, it had been less than 7 for a 9-game stretch.
An xGD of -5.8 during that stretch means one thing: those results were not unfair. Is it purely coincidental that the xGD against Colorado was significantly positive when the Best XI crept up to 7? CITY finished the season series against Colorado, both with 7/11, out xGD’d them by +2.3, but 1 point to show for it.
5 CITY players have played 1,000+ (technically 997+) MLS minutes this season:
Marcel Hartel, Best XI AM.
Conrad Wallem, Best XI LWB.
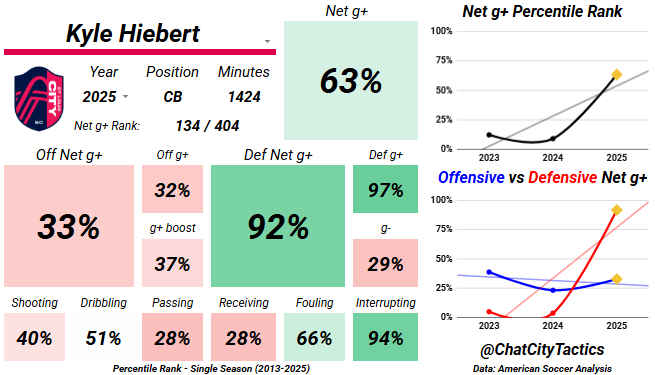
Kyle Hiebert, 5th-string CB.
Josh Yaro, 6th-string CB.
Akil Watts, depth CM, RWB.
Not ideal. Is it fair to say injuries cost Olof his job? I think so. Is that the only reason Olof lost his job? No.
The real reason CITY fired Olof is that CITY has 11 points and has scored just 10 goals in 15 MLS games.
Is that an Olof problem? Let’s compare him to his predecessors as CITY manager.
In 2025, CITY is last in the MLS with 0.67 goals per 90 minutes. Compare that to 19th in 2024, and that hilarious 3rd in 2023, you can clearly see the decline in goals per 90 in the chart:
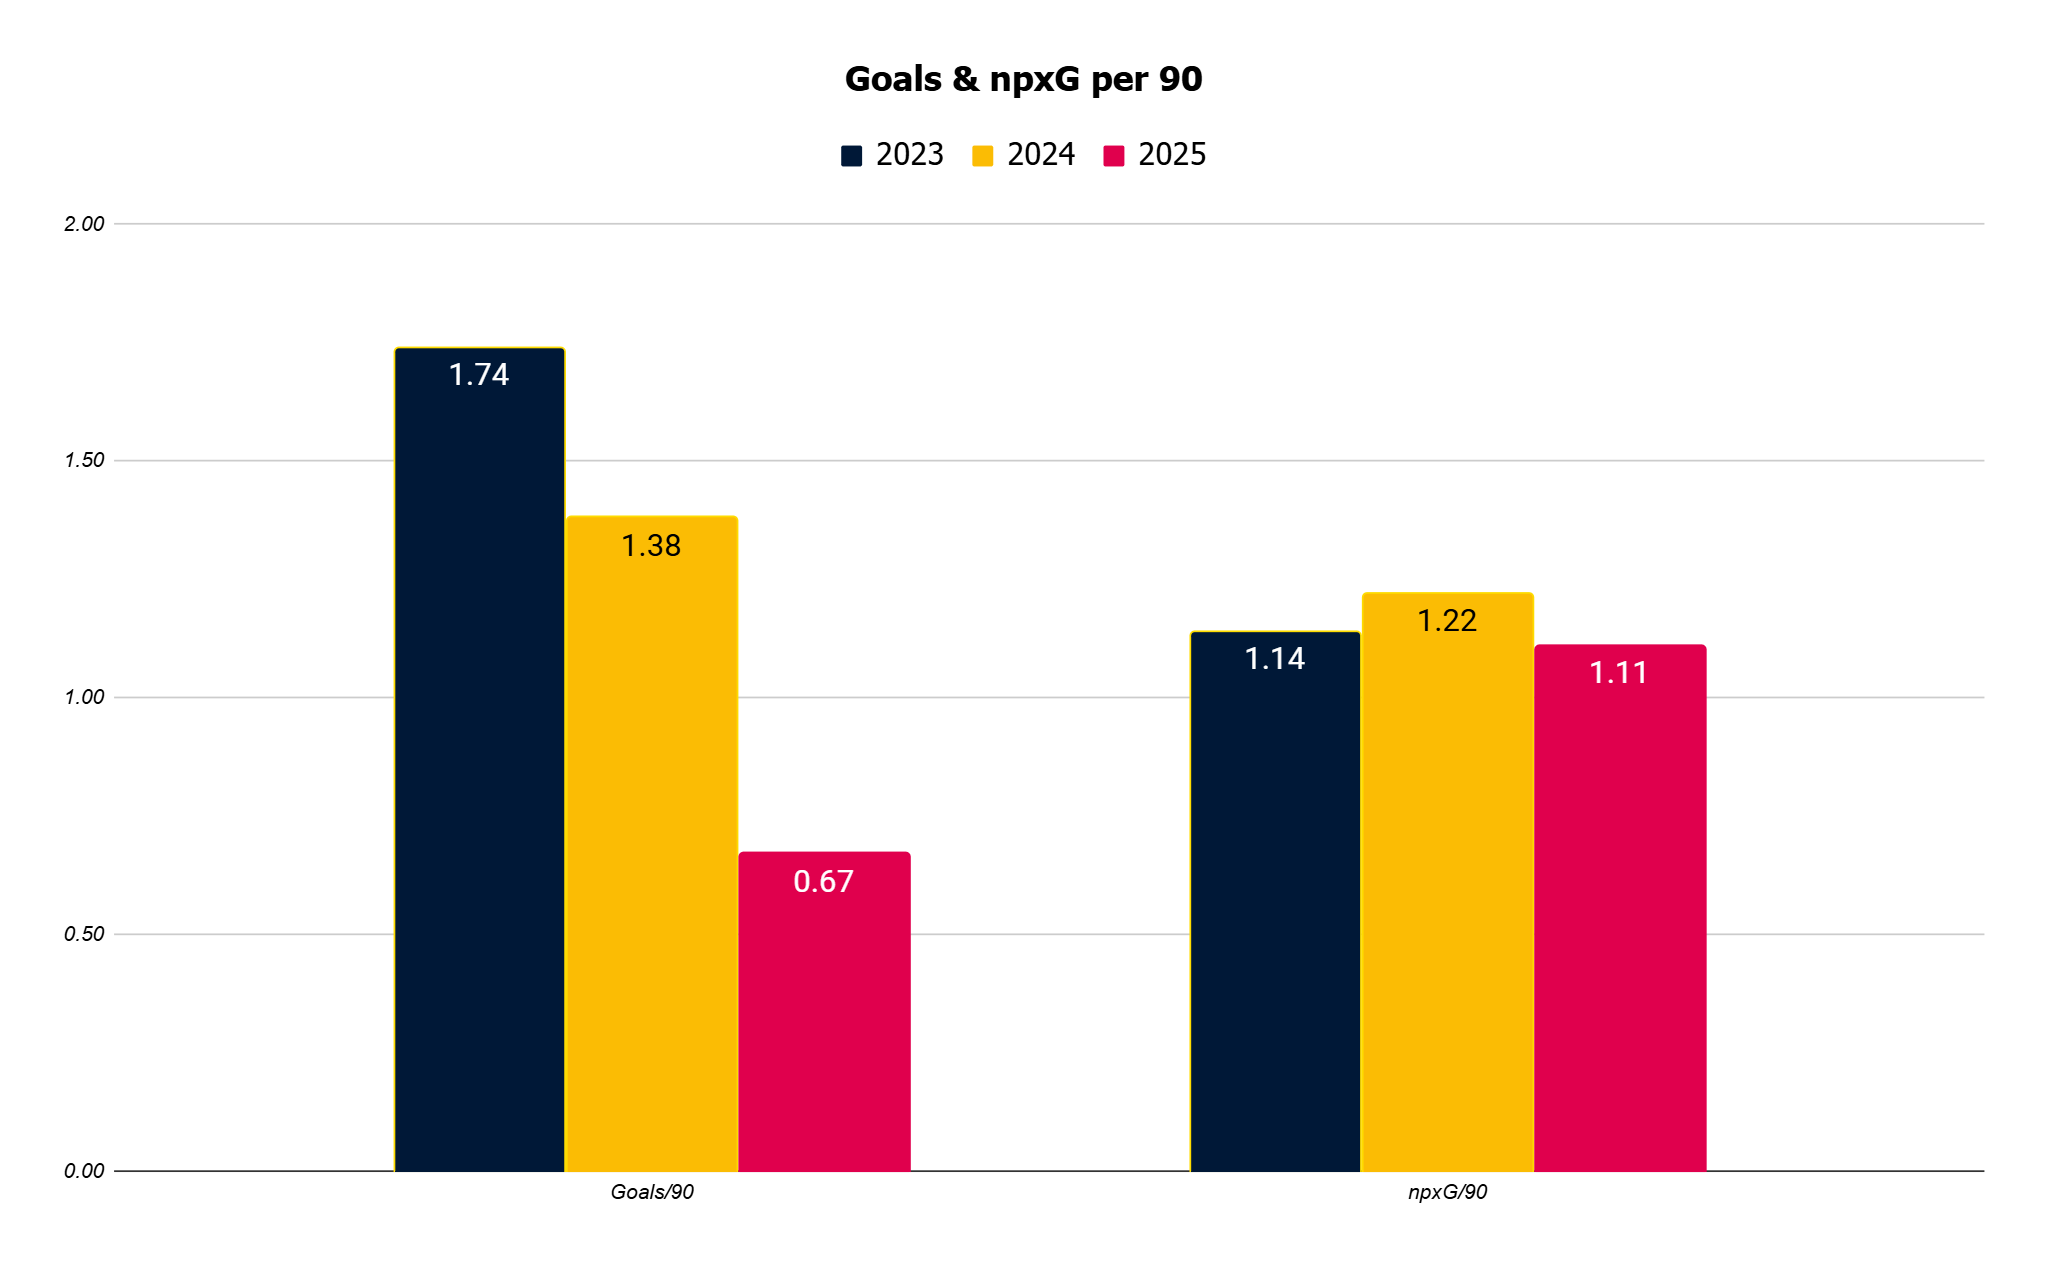
However, it also indicates that, on a per 90 basis, CITY produced fewer npxG (non-penalty expected goals) per game under Olof compared to the previous two seasons, though the difference is quite marginal: 19th in 2023, 20th in 2024, and now 22nd in 2025.
Looking at that, my first question is: if npxG was staying relatively stable while goals were decreasing, does that mean CITY was accumulating npxG from more poor shots? It doesn’t seem that way. In fact, CITY was actually creating over 1 Great xG chance per game. A deep dive on this is coming SOON, but a Great xG chance means 0.33+ xG, indicating at least a 33% chance of scoring. Creating more than 1 of those per game is impressive! However, when you examine Good xG chances per game, the number drops significantly. Good xG = between 0.15 and 0.32 xG.
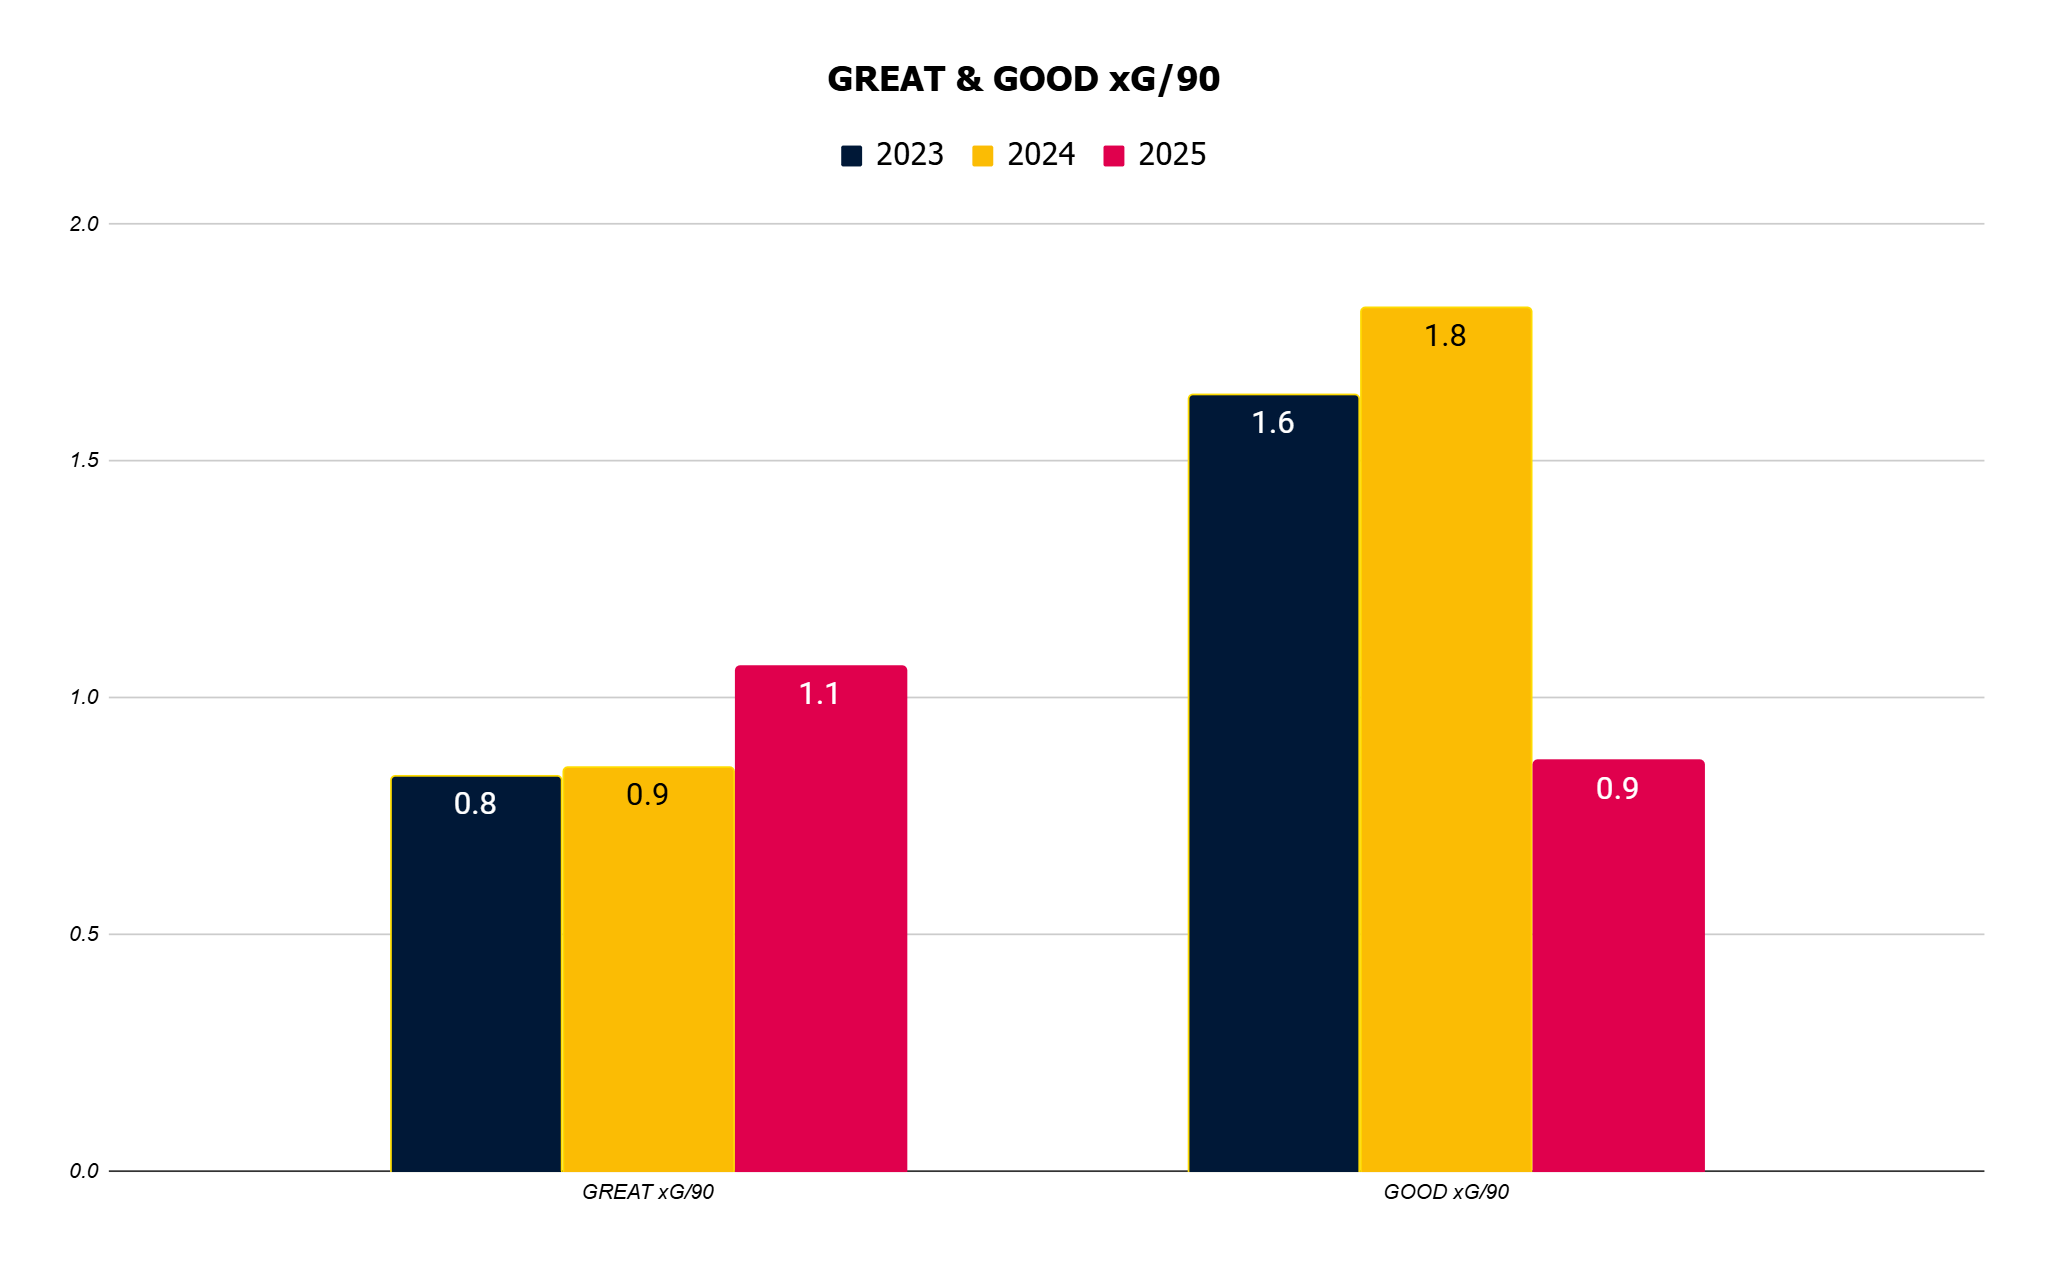
I look at that and think, okay, under Olof, CITY isn’t just generating npxG from low-quality shots because CITY is actually improving at creating great chances, most likely from fast breaks and counters. However, CITY does not consistently create good chances, and that’s the issue, right? CITY has simply failed to generate quality chances consistently, which resulted in CITY scoring 10 goals in 15 games.
Well, not exactly. The other issue is that Olof’s CITY was really, really, really unlucky.

21 players took at least one shot under Olof. Two (2) players are overperforming their xG, Célio and Löwen, because they both have 1 Goal on less than 1 xG. Becher and Wallem alone combine for -4 of that -7.7 G-npxG. Only ATX has a worse underperformance so far in 2025.
And here’s the thing about the over/underperformance of xG in MLS - this is MLS. There has to be an understanding of where that sits in the global soccer food chain. Players who consistently, year in, year out, overperform their xG are widely considered the best finishers on the planet. You know that Bouanga guy in LA, Golden Boot winner, who scores goals for fun? In his four seasons at LAFC, he’s underperformed his xG three times. Benteke at DC? A similar story, underperforming in three out of four years. So, before you get in my mentions screaming that CITY don’t have a “finisher” and that’s why they are unlucky, I think you would probably classify the league’s top goal scorers of the past two seasons to be finishers, yet they both underperform.
To summarize, CITY scored significantly fewer goals than in previous years, while generating similar xG numbers and vastly underperforming their xG. Whose fault is that? Olof’s? Yes. The players? Also, yes.
“Too Defensive!” was a reply I received frequently when talking about Olof-ball, but was it true?
Let’s start with possession. It is very difficult to decipher because Hack and Carnell each took a chunk of 2024. However, from a calendar perspective, Olof’s CITY in 2025 was the most passing-oriented of our existence. Passing accuracies increased across the board.

CITY was last in passes and second to last in accuracy in 2023. In 2024, that improved to the 3rd fewest passes and 3rd worst accuracy. In 2025, passes dropped back to the second fewest, but accuracy increased to 25th, or outside the bottom 5! And obviously, these are not vastly important metrics, but just an interesting highlight.
If you know anything about me, you know I am obsessed with ball progression. So, how did Olof compare?

Not well. Decreases across the board. Bottom 3 in both categories in 2025, with a massive drop from the 15th place PrgP in 2024.
Taking the last two charts together reveals a clearer picture. Olof’s CITY improved their passing percentages by avoiding progressive passes. This means CITY wasn’t aggressive, adventurous, or forward-thinking in their passing under Olof. No surprises there; we could discuss plenty of other possession metrics, but overall, these don’t necessarily indicate that CITY under Olof was more “defensive.” However, they do suggest that CITY was more cowardly.
However, if we are going to discuss defense, let’s discuss defense, because I find what Olof did fascinating in contrast to previous regimes.
First off, a reminder that CITY’s defense has sucked.
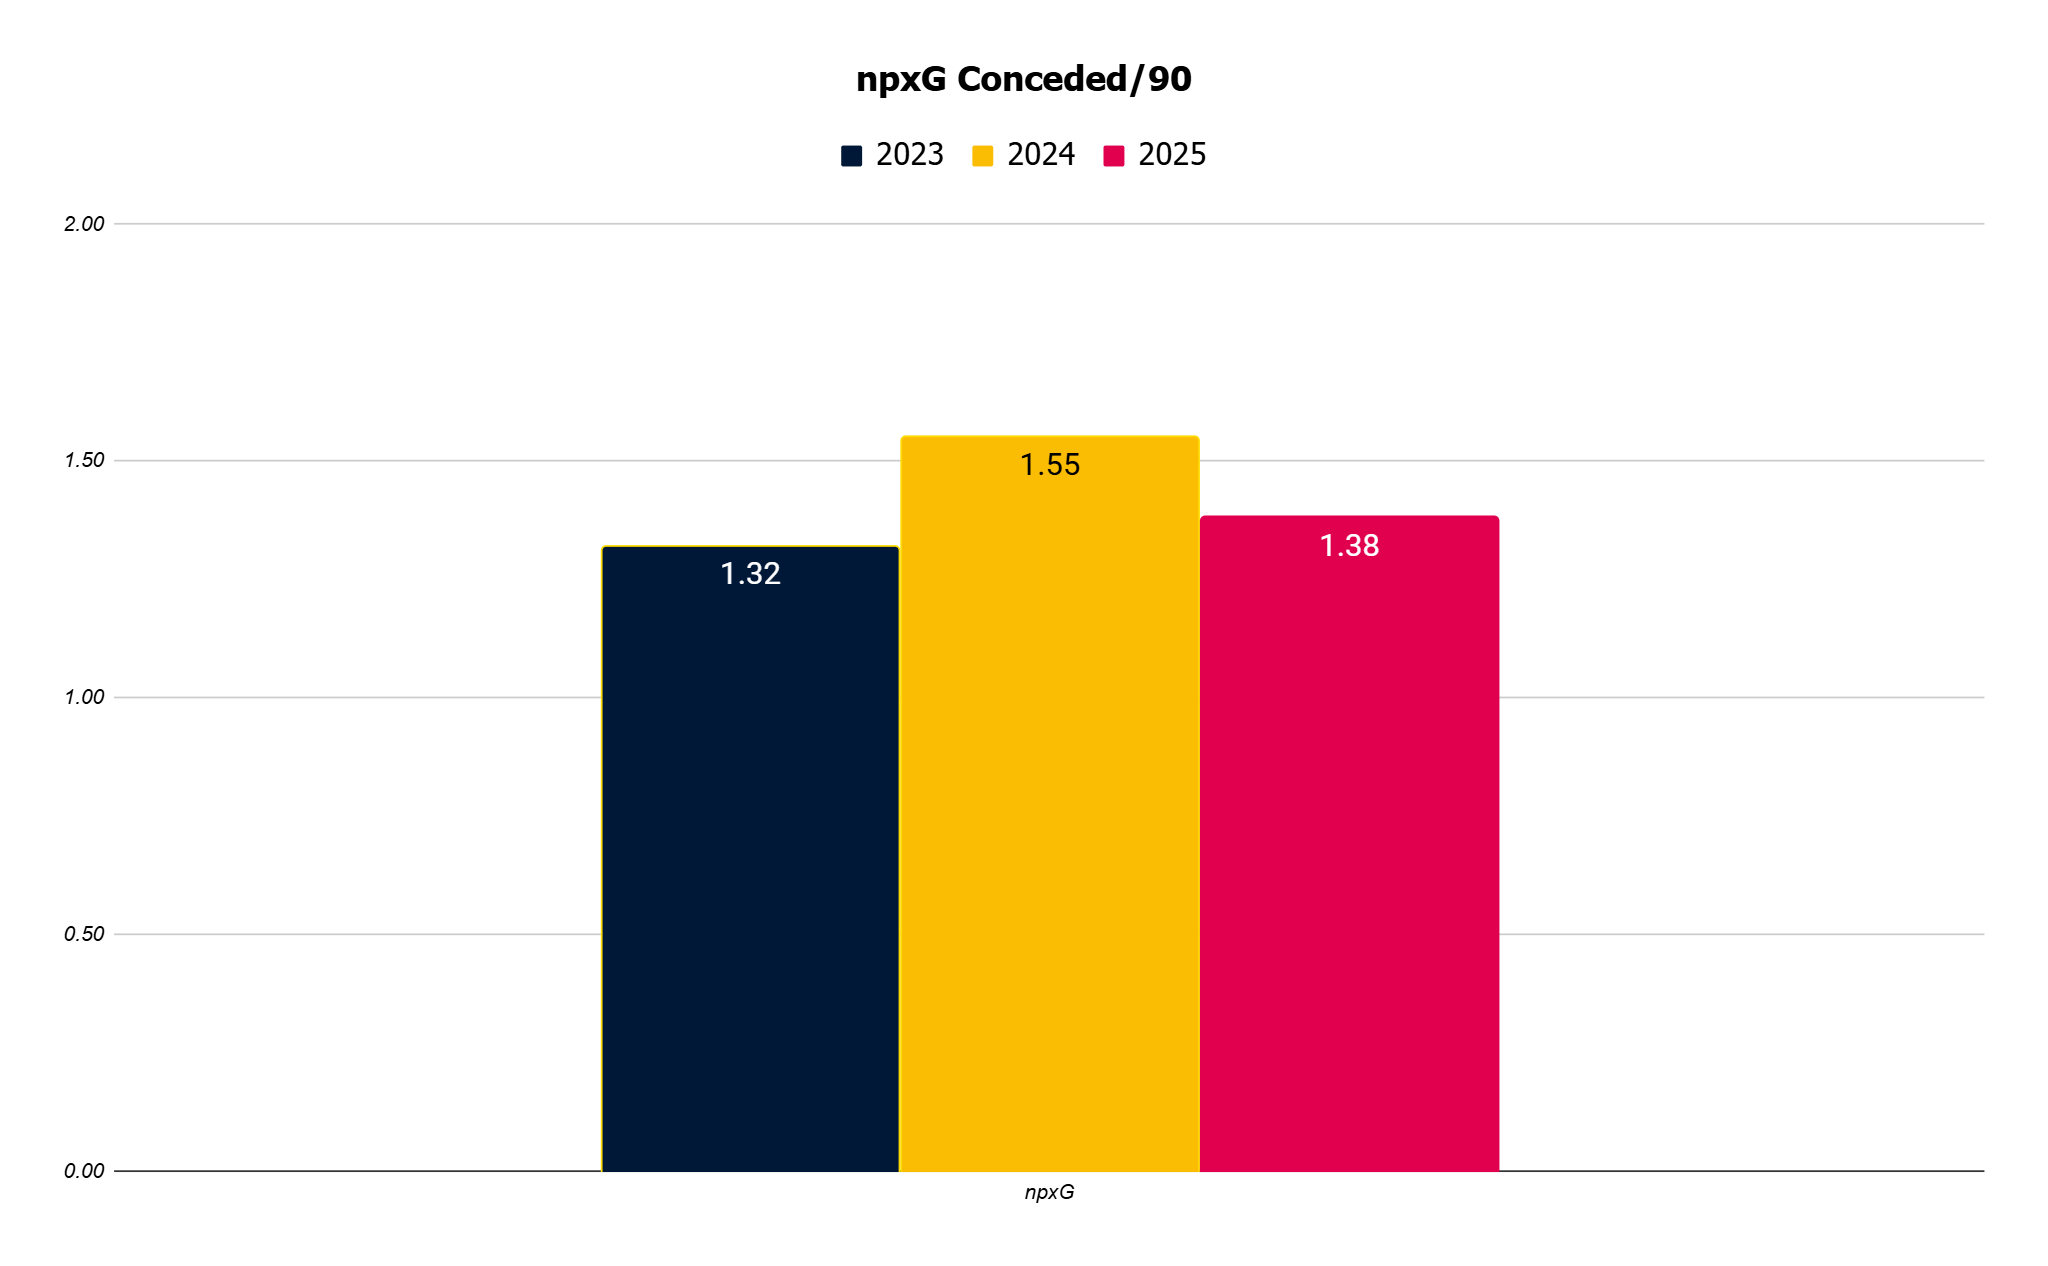
In 2023, CITY had the 9th worst npxG against. In 2024, the bottom fell out, and CITY dropped to 3rd worst. Under Olof, CITY reverted to a mid-table 18th (without most of the starting defensive unit due to injuries). But Olof achieved this by allowing the opposition to progress significantly more than in the previous two years.

And, he didn’t have his team make a lot of tackles.

So, what did he do, exactly? He eliminated space. Space is the enemy of defense. Whether that be wide, in front, behind, etc., space can be exploited.
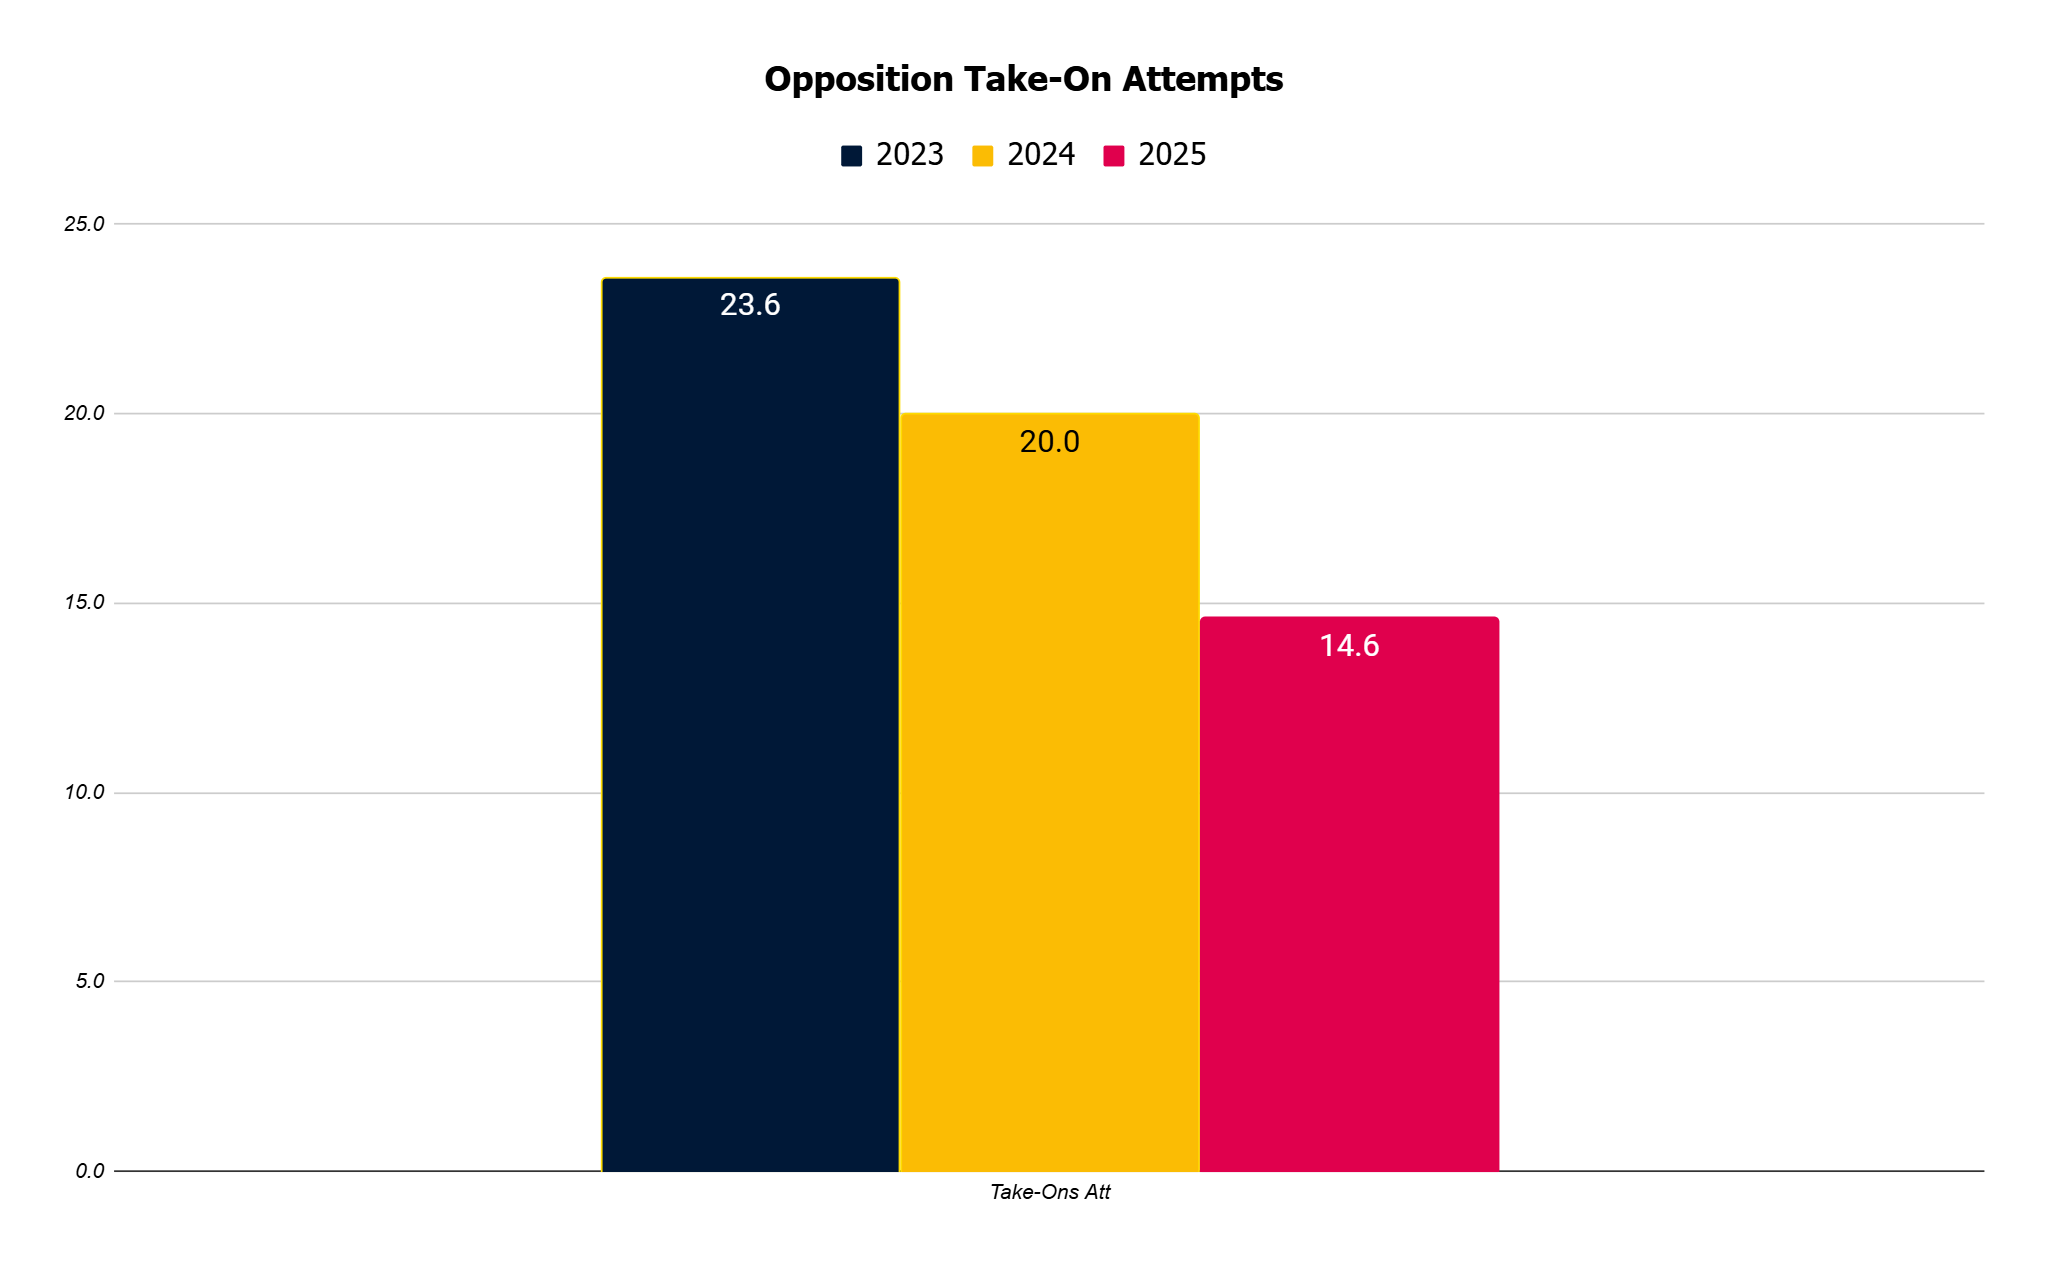
In 2023, teams attempted more dribbles against CITY than any other team in MLS. In 2024, CITY fell to the 2nd most dribbles attempted against. Under Olof? That number dropped to 25th, or 6th fewest dribbles attempted against.
And how did he do that? By conceding territory. He allowed teams to progress the ball up the field and used additional bodies and the shrinking of space to counter the opposition. As you saw, CITY’s tackles in the attacking and middle third dried up under Olof, because CITY stopped the press, and to be fair, the press hadn’t worked in the past 18 months whatsoever.
And this is where I want to pause using statistics for a moment and have a discussion, using other football terms instead. CITY under Olof was like playing Redzone defense. When you are playing defense at midfield, you’ve got to be worried about a run inside, a run outside, sweeps, short, medium, long passes, etc. But when that football gets inside those final twenty yards, there’s no more space for those medium and long passes. The offense’s myriad of options begin to run out, and it becomes a game of running the ball up the middle against a goal-line defense.
That’s what Olof did; he played prevent defense, allowing the opposition to pass and dribble their way up the field. Then, when they got into the Box (Redzone), his goal-line defense didn’t have to worry as much. The issue with that goal-line defense is that you often substitute fast secondary players for stronger, bigger bodies to clog up space. And that’s what CITY did. That’s why people label Olof as “too defensive.” Because the bodies on the pitch were not set up to succeed when that defense turned to offense.
We’ve talked for months about Olof’s team selections, so I’m not going to harp on it again and again, but there was a critical failure in his decisions, and that's why he is no longer employed.
The Back 3/5, whatever you prefer to call it, fits the Best XI like a glove, and it makes absolutely perfect sense that he would opt for that. In my first ever Substack post, almost a year ago, Tactics 101, I talked about the 3-5-2 last, and concluded with:
CITY: If CITY can find a LB, this formation is absolutely on the cards. In this scenario, Totland would likely be a rockstar. 3/5-man defenses go in and out of fashion. Many dismiss them due to their defensive inclination, but with this current CITY squad lacking in W10s, it’s an exciting option.
But if you notice, I prefaced that by saying the Best XI. Olof has very much not had the Best XI available to him, which is likely partially his fault and partially due to bad luck. However, when you run out, for lack of a better word, shit like this:

What could you possibly expect other than playing goal-line defense? He knew, or should have known, his job was on the line with week after week of subpar performances and no wins. To his credit, he tried many different tweaks, more than we saw from either Carnell or Hackworth during their struggles. However, the problems with Olof ball ran deeper than making a tactical adjustment here or there. He refused to change the core—the core that kept failing week after week. This core:
Sadly, the decline continues.

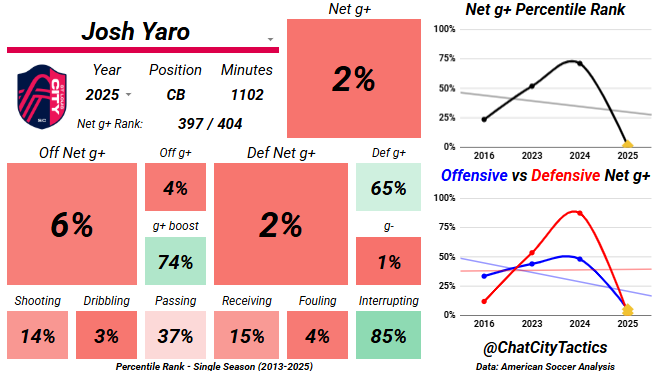
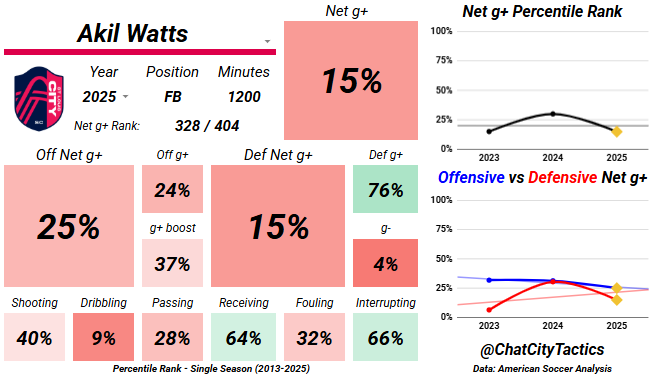
Remember, only five players have logged over 1,000 minutes for CITY this season, and three of them are right there. What do all four of those players have in common? All four have played RWB at some point this season under Olof.
There’s so much more to discuss, and I’m tired of repeating the same points for months, but maybe, just maybe, if Olof had played the kid on the MLS senior roster who is a natural RWB in that position, he’d still have a job. Most likely not, but maybe. We will never know.
However, we do know this: this is what will get you fired.

The David
So, David. Critch, what can we expect? What do I, Michael from CCT, want from you?
Courage.
Don’t select the guys who play every week just because they play every week. Look at the team and see who’s available. Observe what the opponent wants to do. Determine what you want to achieve, and choose a team that aligns most closely with that.
Ask the simple questions: What do we want to do with the ball? How do we do that? What do they want to do with the ball? How do we stop that?
Be passionate and steadfast. YOU got yourself here.
You’ve been given the chance that many dream of. Enjoy it. Embrace it. Earn it.
When you walk out of that tunnel on Saturday afternoon, remember that those cheers are for you. Those cheers are filled with hope and excitement. There haven't been enough of those cheers lately.
I’m here to support you, Critch. To support this team. To support these players.
And I’m not alone.
#AllForCITY, forever and always.
Phenomenal breakdown — seriously one of the most data-grounded manager profiles I’ve come across in a while.
One angle that might add even more depth: examining xT zones where possession sequences consistently broke down, particularly in relation to timing. I’ve noticed a recurring drop in final-third xT buildup after the 60th minute — possibly linked to substitutions, fatigue, or tactical inflexibility. Curious if you’ve come across any meaningful splits when comparing pre- and post-60th minute metrics (not just xT, but also PPDA, pass networks, or progression routes). Could be another layer to understanding why Olof’s game states often shifted late. Lacking adaptability and in game shifting patterns.
Would love to hear your thoughts on that. Really enjoyed this piece — excellent work!